Compute Histogram
 This demonstration shows how to compute and display an Histogram.
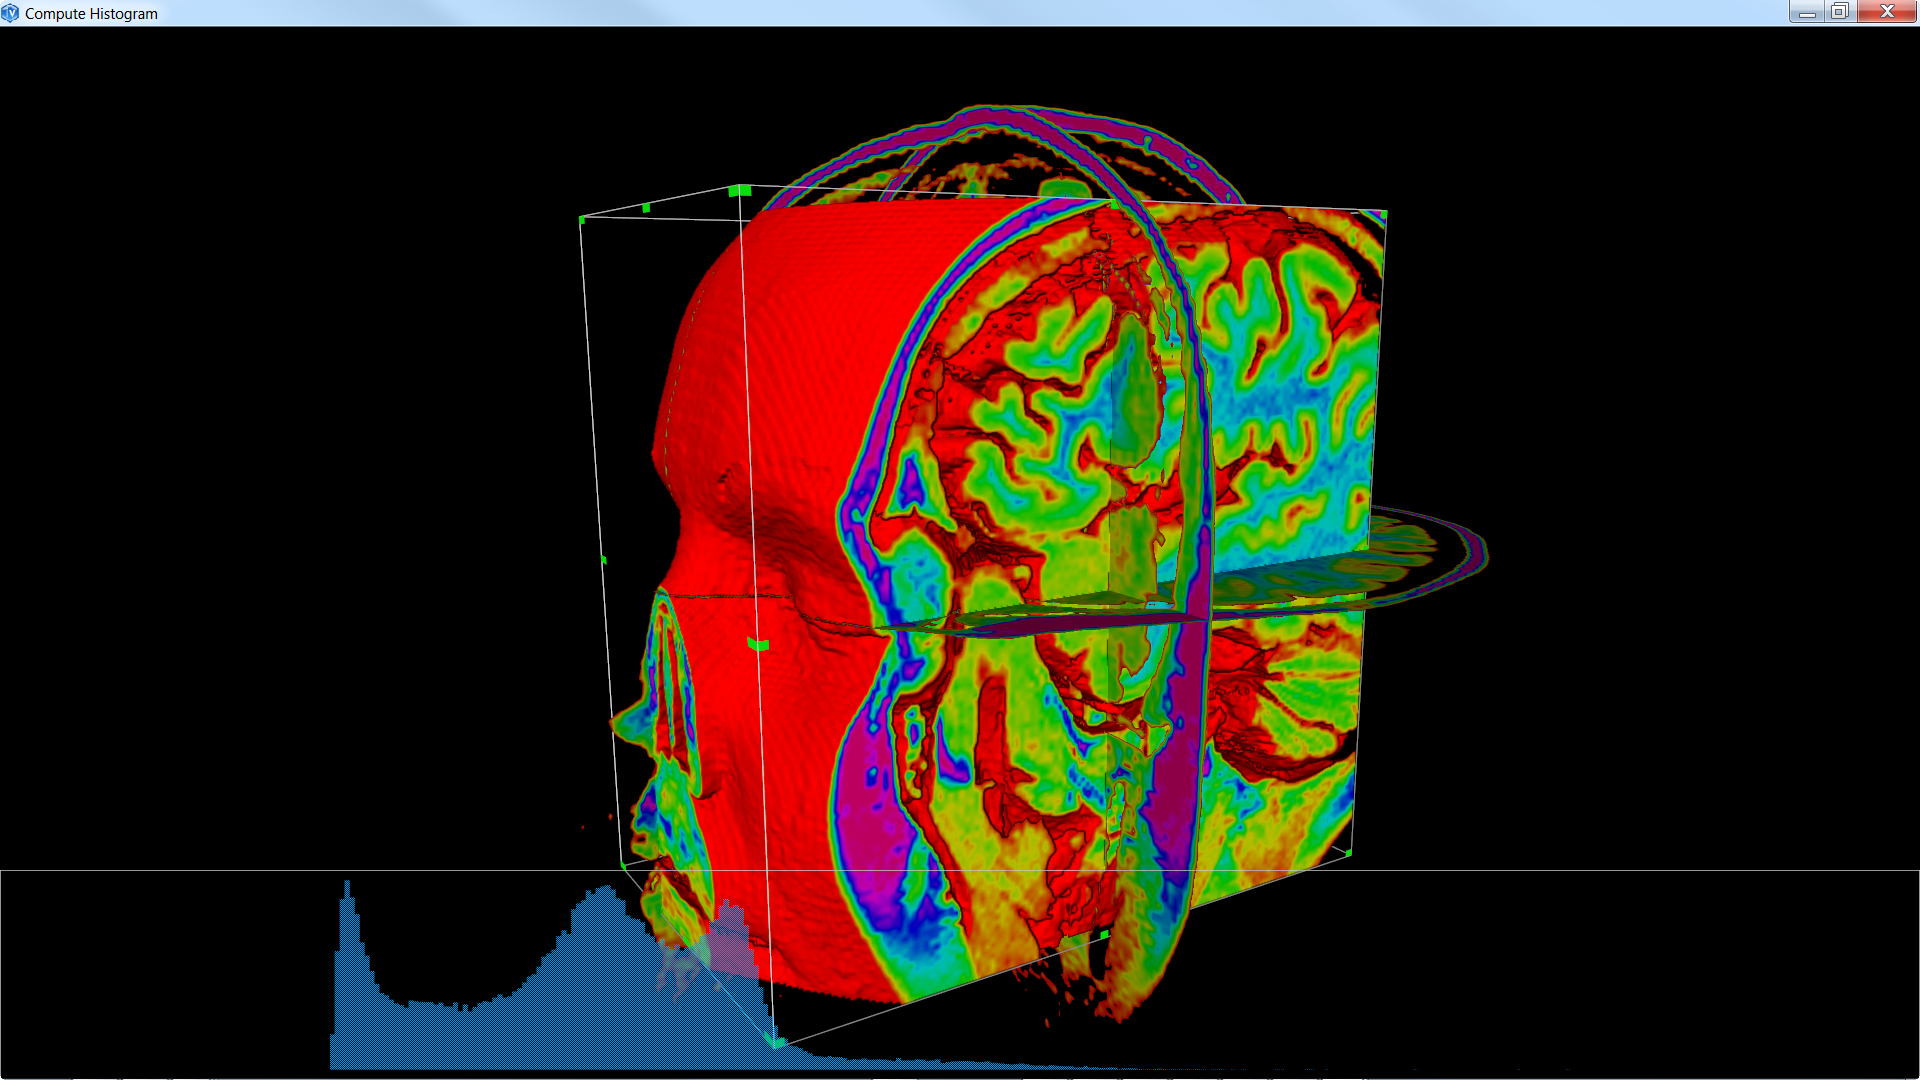
It loads a volume using VolumeViz and dynamically computes the histogram of the region defined by the ROI. Histogram result is displayed using a bar chart in a PoSceneView.
FILES:
- Medical/Analysis/medicalComputeHistogram/computeHistogram.cxx
SEE ALSO
SoVolumeHistogram, SoTransferFunction, SoDataRange, SoLDMDataAccess, SoVolumeSkin, SoROI, SoROIManip, PoDomain, PoSceneView
SCREENSHOT: