2D Histograms
 Demonstrates how to use 2D histograms.
Demonstrates how to use 2D histograms.
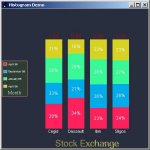
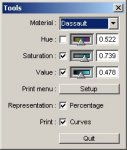
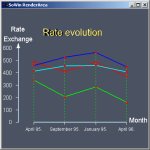
An example program that draws a 2D Histogram chart with a corresponding linear plot. The program has a dialog interface to change the various parameters like material, color, etc.
FILES:
- MeshViz/Demos/graph/histoDemo2D.cxx
SCREENSHOT: