Volume dynamic histogram computation.
 This demo shows how to compute and display Histogram.
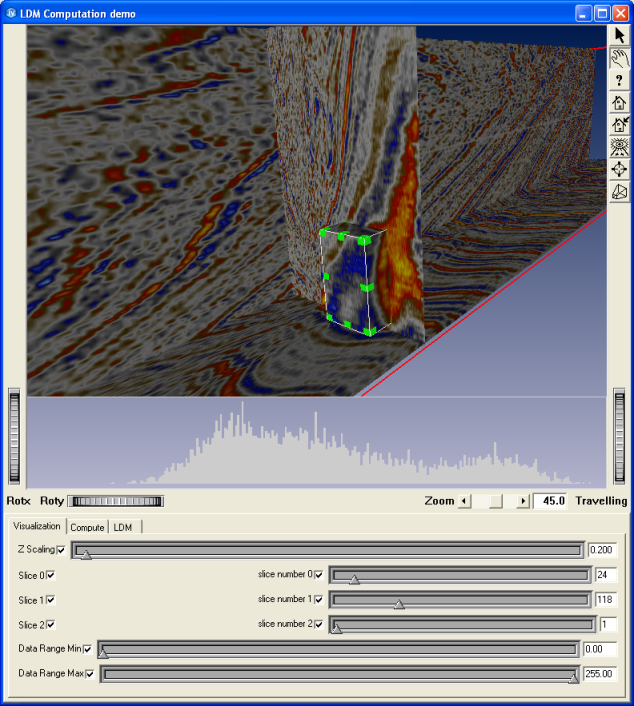
The demo loads a volume using VolumeViz and dynamicaly computes the histogram of the region defined by the ROI. Histogram result is diplay using a bar chart in a PoSceneView.
FILES:
- VolumeViz/Compute/ComputeHistogram/ComputeHistogram.cxx
- VolumeViz/Compute/ComputeHistogram/GuiDialogViz.h
- VolumeViz/Compute/ComputeHistogram/GuiDialogViz.cxx
- VolumeViz/Compute/ComputeHistogram/OivSceneGraph.h
- VolumeViz/Compute/ComputeHistogram/OivSceneGraph.cxx
- VolumeViz/Compute/ComputeHistogram/AuditorVisualization.h
- VolumeViz/Compute/ComputeHistogram/AuditorVisualization.cxx
- VolumeViz/Compute/ComputeHistogram/AuditorColorMap.h
- VolumeViz/Compute/ComputeHistogram/AuditorCheckSwitch.h
- VolumeViz/Compute/ComputeHistogram/colormap.txt
SEE ALSO
SoVolumeHistogram, SoLDMDataAccess, SoTransferFunction, SoVolumeSkin, SoDataRange, SoROI, SoROIManip, PoDomain, PoSceneView
SCREENSHOT: