Display the results of an analysis as curve or histogram.
 AnalysisCharts This example demonstrates how to display the results of an analysis as curve or histogram.
DESCRIPTION:
- This example demonstrates how to display the results of an analysis as curve or histogram.
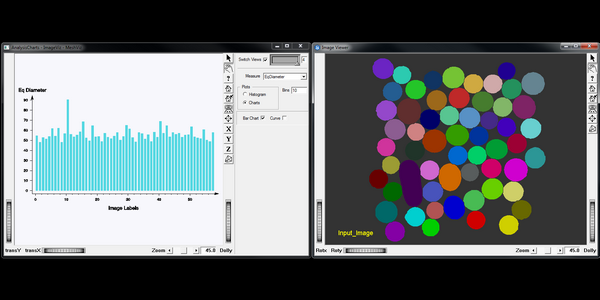
SCREENSHOT:
FILES:
- ImageViz/ResultsDisplay/AnalysisCharts/AnalysisCharts.cxx